Smart Variant Analysis Filters, Scoring, and Reporting Tools
Select the data to be analyzed and enter the workspace.
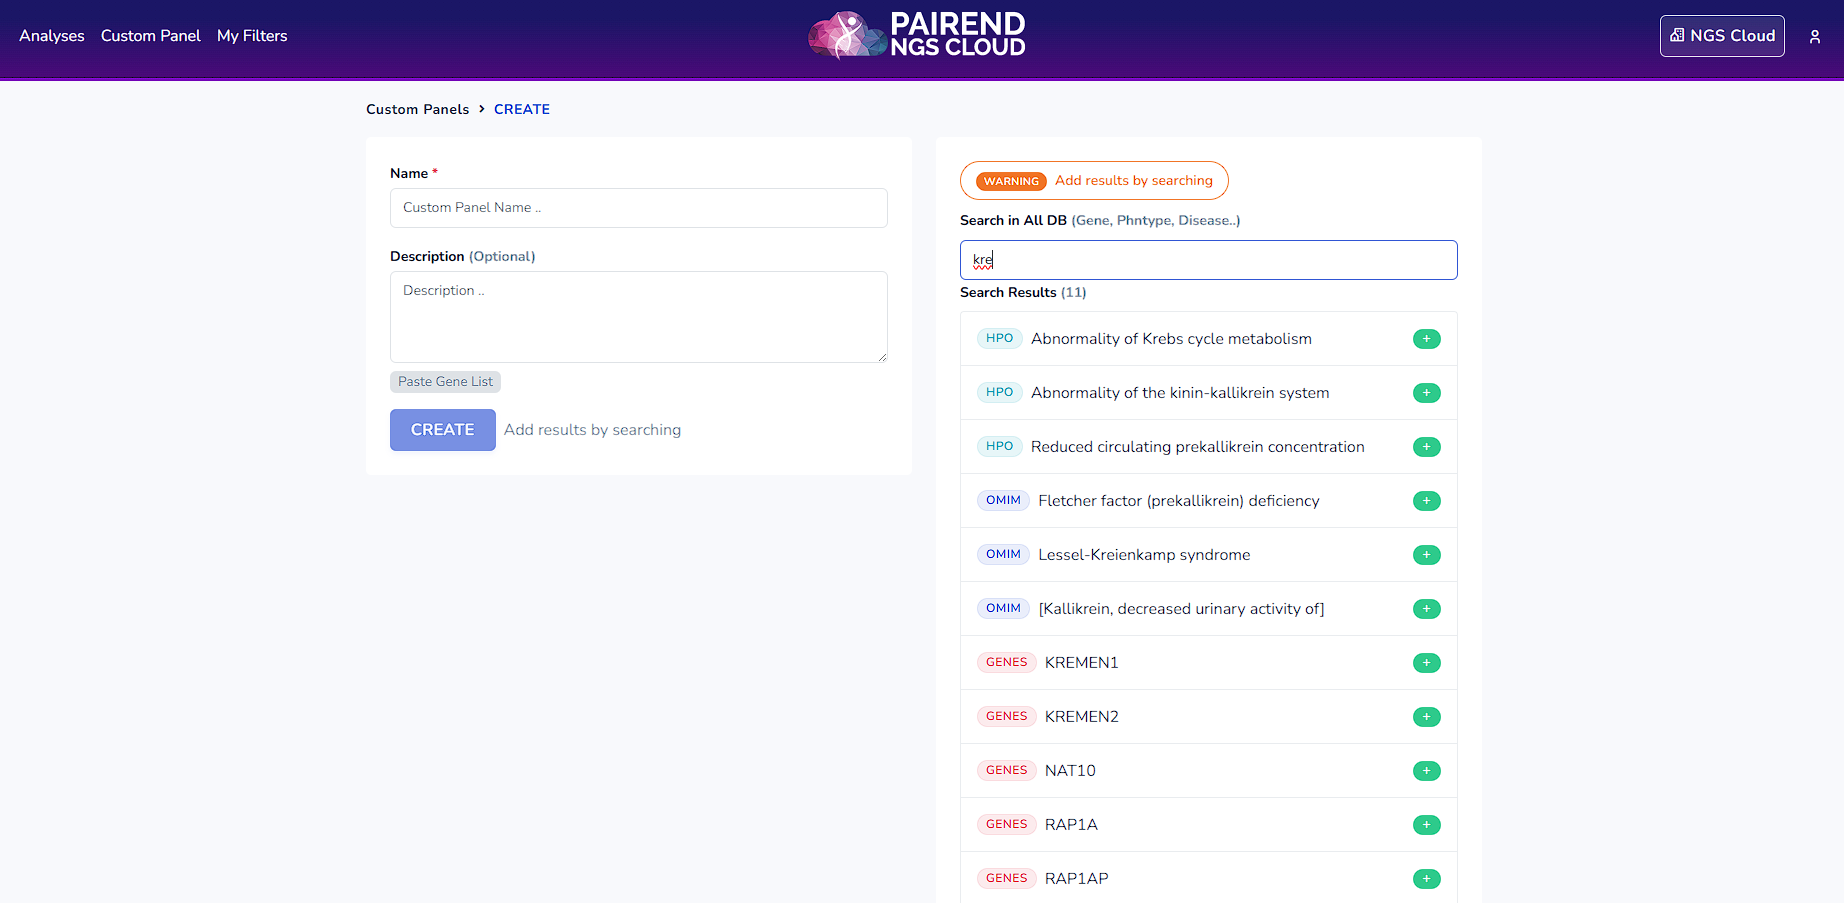
The Custom Panel Creation:
For the analysis it is possible to create an in silico custom panel. Click Custom Panel and enter genes, phenotypes or diseases that are related to the case. Click enter to search for the options. Select them by clicking + button. Write a custom panel name, write down the description (optional) and click CREATE button.
The Filters and My Filters:
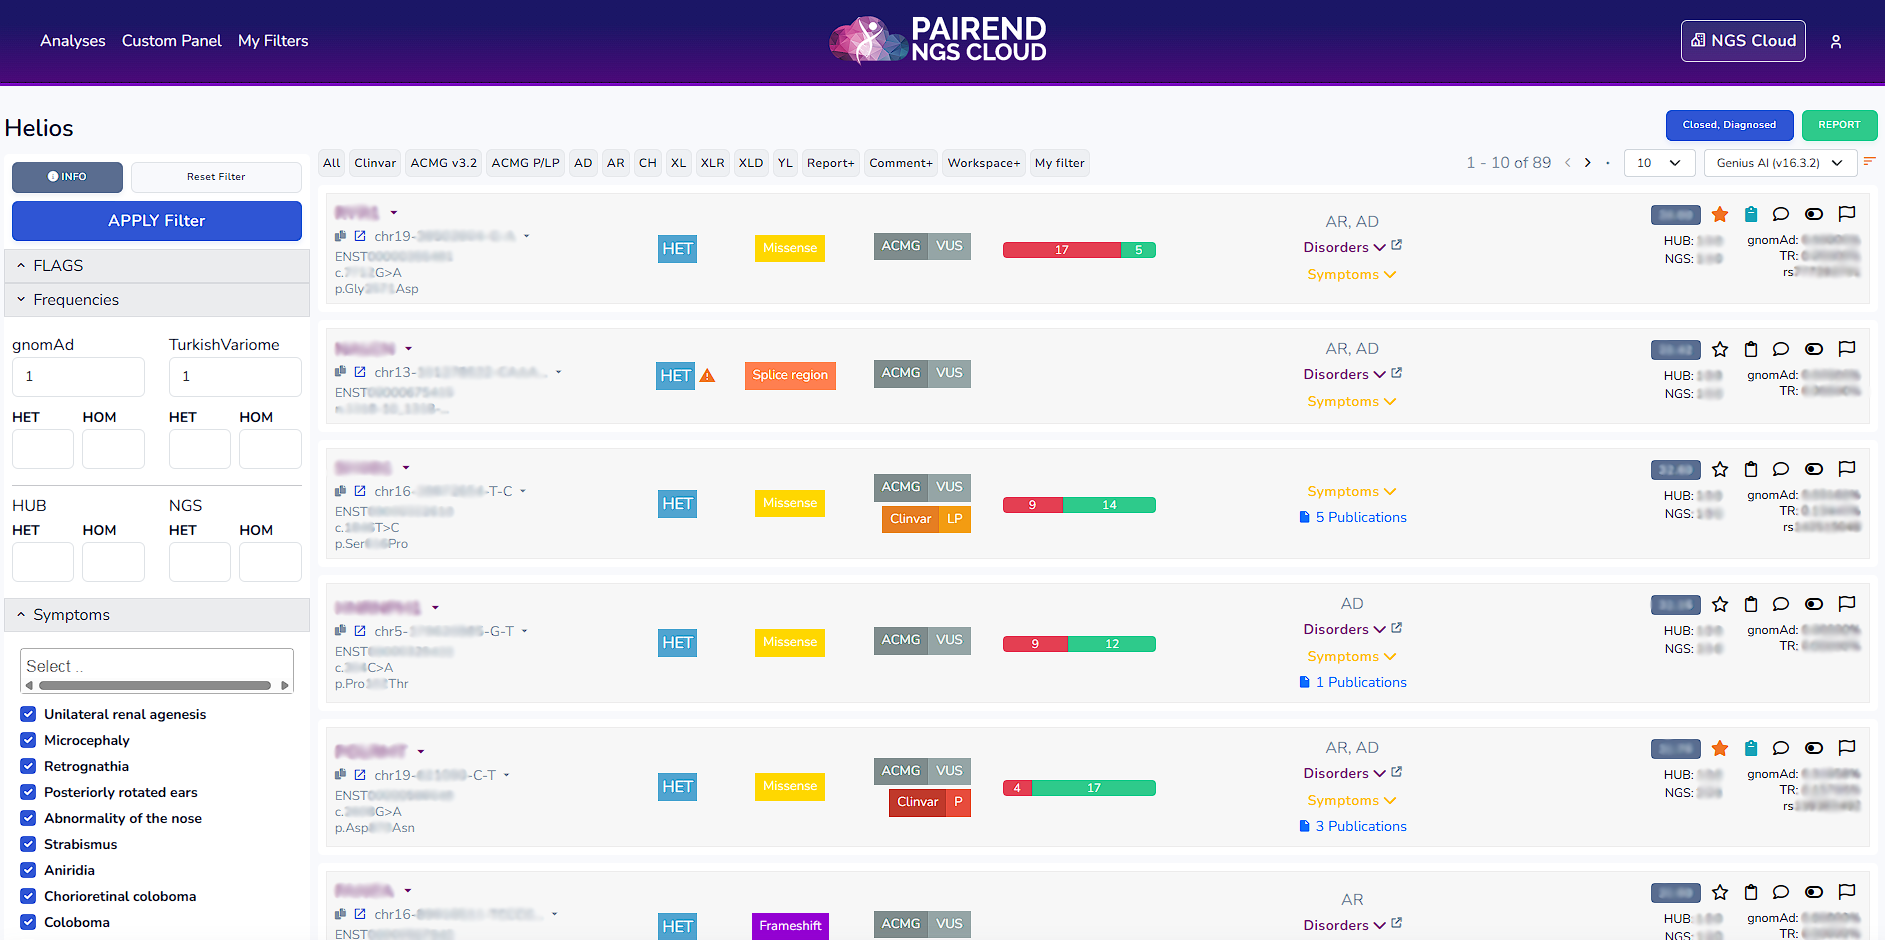
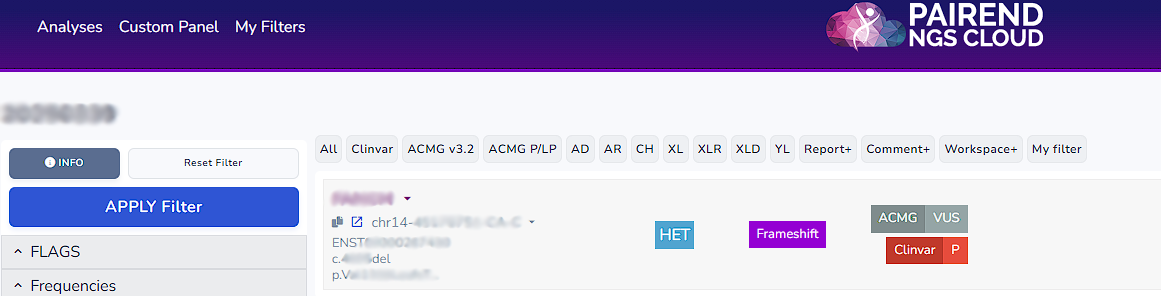
NGS Cloud offers default filters: All (shows all the variants), Clinvar, ACMG v3.2, ACMG P/LP, AD (Autosomal Dominant), AR (Autosomal Recessive), CH (Compound Heterozygote), XLR (X linked recessive), XLD (X linked dominant), YL (Y chromosome linked), Report (variants that are reported), Comment (variants that possess a comment), Workspace (variants that are kept within the workspace).
Once you click the filters on the left side the definition of the filter can be accessed. For instance in Clinvar filter below mentioned variants are being filtered.
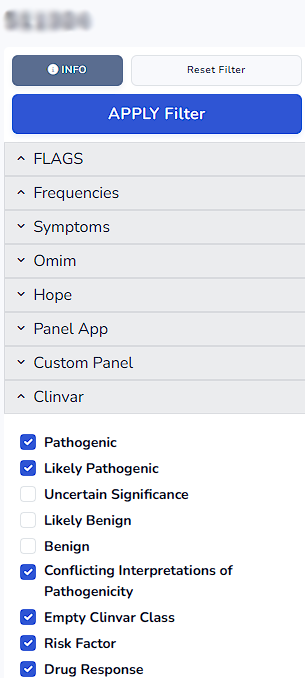 On the left side of the workspace you can find the entire list of filters from which you can apply filters. By clicking the arrow beside each filter you can access the select or search section for each filter.
In default analyses 30<heterozygote variants<70 and homozygote variants>85 are being shown. If you want to see all the variants UNCLICK VAF Check in the AD-DP-GQ section within the filters section.
Hope (see within the filter list) is our ontology library from which one can look up for phenotypes. It can be used when HPO terms in the symptoms section are not enough.
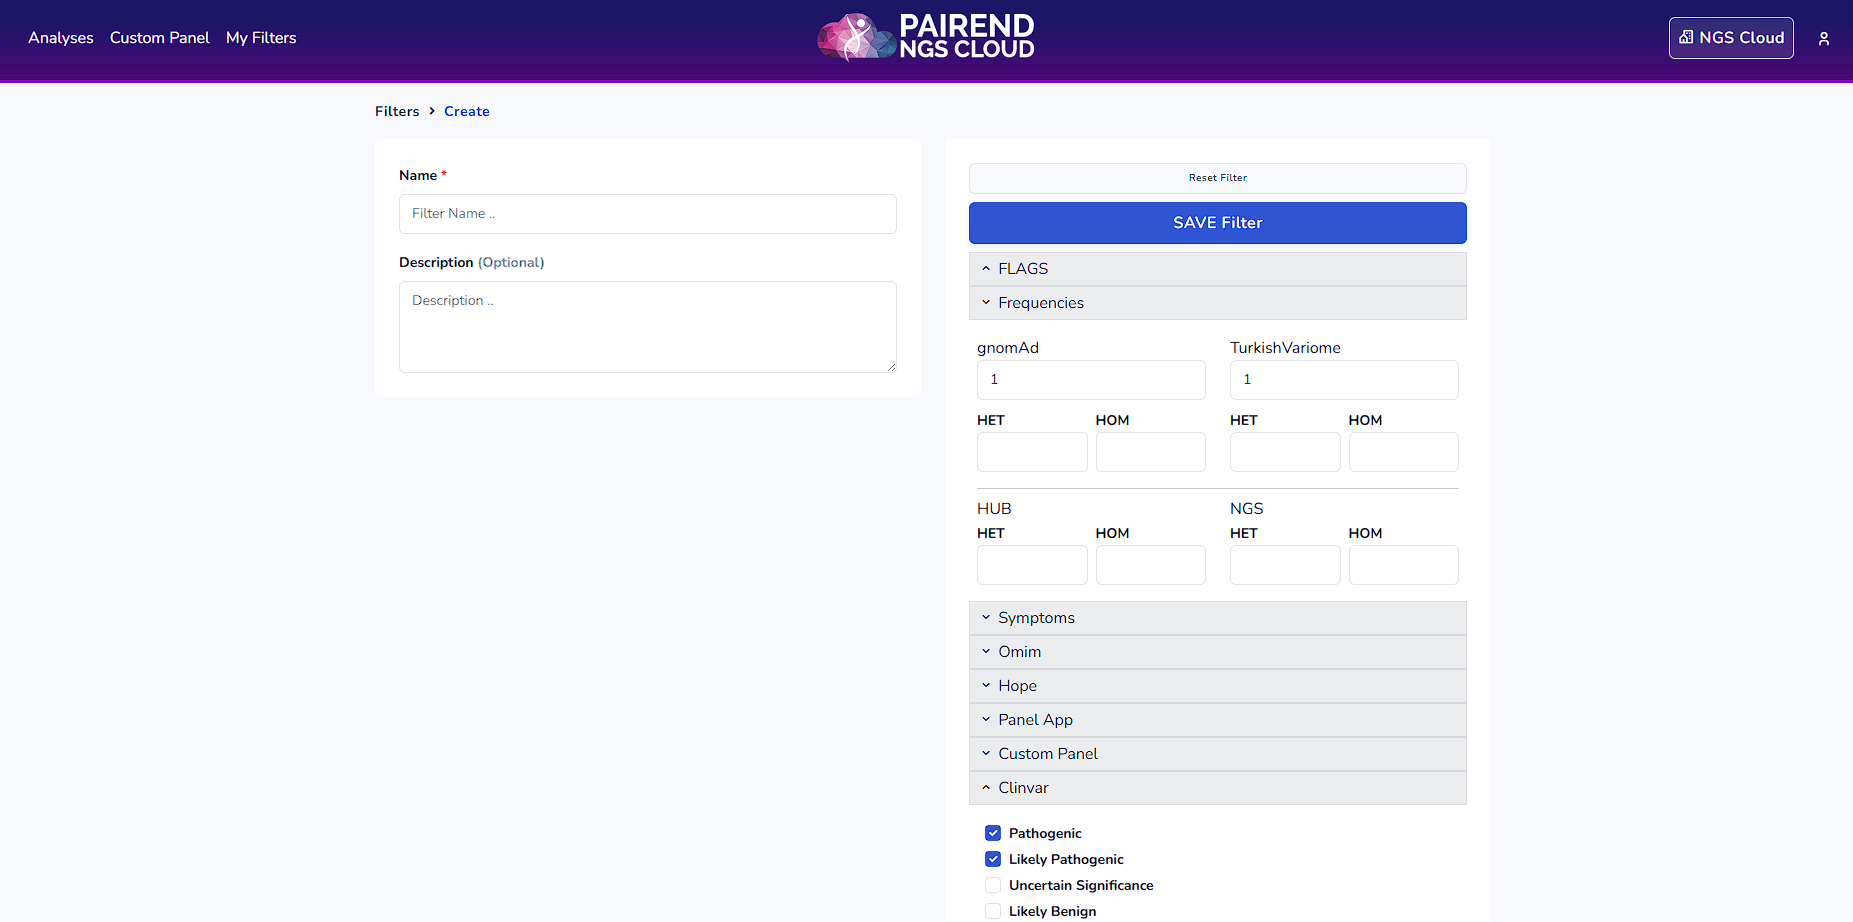
From My filters section one can select from the filters listed, name it, write a description and create a filter.
The Scoring Systems:
Apart from the filtering, NGS Cloud also provides scoring systems.
Genius AI scoring lists the variants based on our in house Genius algorithms criteria.
Priority scoring lists the variants considering its relation to the phenotype (HPO terms).
Phenotype scoring lists the variants considering its relation to the custom panel (gene, phenotype and disease).
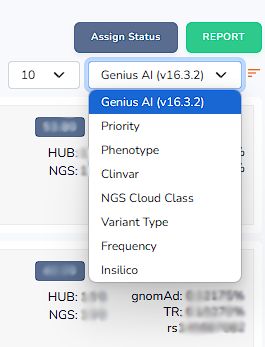 Clinvar scoring lists the variants considering its relation to Clinvar evaluations.
NGS Cloud Class scoring lists the variants considering its relation to ACMG evaluations.
Variant type scoring lists the variants considering its relation to the variant type.
Frequency scoring lists the variants based considering its relation to the gnomAD frequency.
Insilico scoring lists the variants based considering its relation to the insilico pathogenicity scores.
By clicking the orange listing button one can lists the variants from most related to least related. Alternatively one can also list the variants in an order starting from least related to most related.
Variant Cards
Variant Card includes the gene name (example gene: MYO7A) along with an arrow from which one can access various databases: OMIM, PubMed, gnomAD, NCBI Gene, HUGO genes, UniProt and MGI (Mouse Genome Informatics).
Besides the chromosomal location (Ex: chr11-77179738-C-T) there is also an arrow from which one can access to various browsers: NGS Cloud Search, UCSC Genome Browser, Ensembl Genome Browser, Decipher Genome Browser, Google
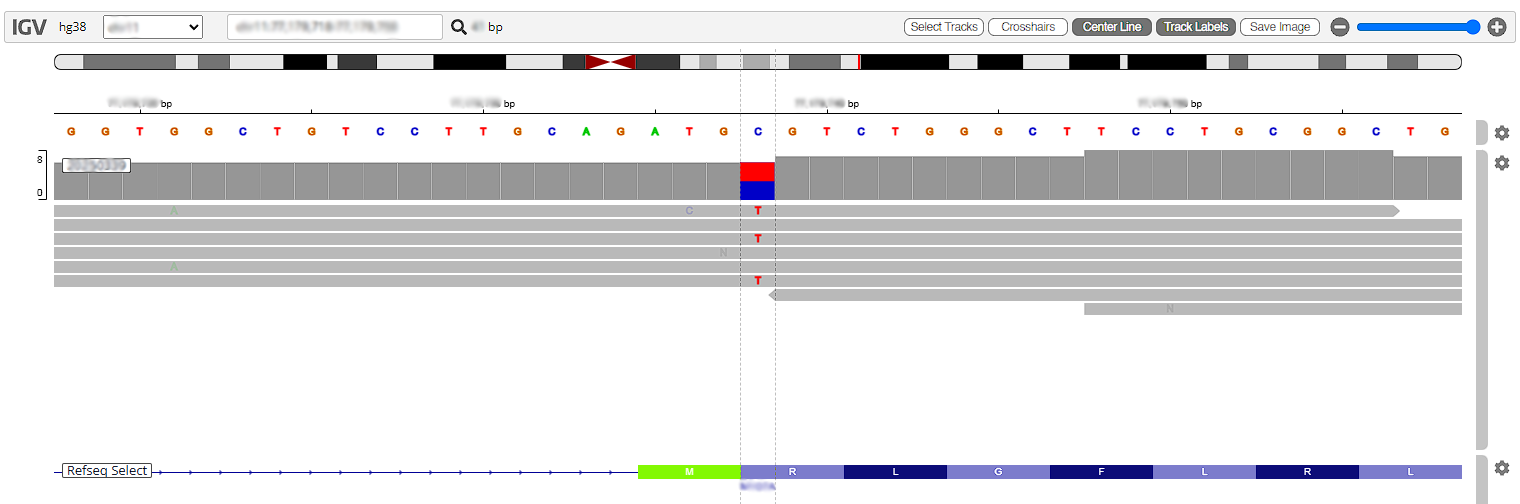
Scholar, gnomAD Browser. One can also access local IGV (if there is one available) as well as the NGS Cloud IGV browser from here. One can analyze the gene in detail by using the IGV Genome Viewer
IGV: Integrative Genomics Viewer
Variant card also includes the transcript number (ENST00000409619), the nucleotide change (c.2338C>T), the amino acidic change (p.Arg780Cys), the zygosity (HET,HOM), the type of the mutation (Ex: Missense), ACMG and Clinvar evaluations, Insilico pathogenicity scoring (Ex: 15 damaging, 7 tolerated), links to publications through Mastermind, frequencies within the HUB (number of het, hom within the facility that does the analysis), frequencies within NGS Cloud (number of het, hom within our in house data pool), gnomAD frequency (Ex:0.00000%), Turkish variome frequency (Ex:TR:0.25873%) and the rs number (Ex:rs782165016)
Variant Card Buttons:
Star (): Click this button to add the variant to the workspace list.
Add to Report (): Click this button to add the variant to the report.
Comment (): Click this button to add a comment about a variant.
Exclude (): Click this button to exclude the variant.
Problem Report (): Click this button to report a problem regarding a variant.
Assign To: An analysis can be assigned to a particular person using this button.
Status: There are 4 status options: Pending Review, Pending Report, Closed Negative, Closed Diagnosed. A status can be selected using the status button.
Report: A pdf report can be generated in various languages using this button. Please contact our team for the final report format for your customisation requirements for your institution.
AI and Traditional CNV (Copy Number Variation) Analysis:
It is possible to do CNV analysis from a single sample in NGS Cloud. One can find AI CNV analysis as well as Traditional CNV analysis below the IGV Genome Viewer section. Here you can see the copy number changes in a diploid pattern.
Aneuploidies: You can examine the changes associated with numerical abnormalities.
Micro Del/Dups: You can review the well-known microdeletion/duplication syndromes.
Genes: You can see deletions/duplications at the gene level in a haploid format.
It is possible to search a particular gene in the Search Box.
Quality Control
Coverage
You can access gene and exon coverages below the CNV section. You can look up for a particular gene from the Search Box.
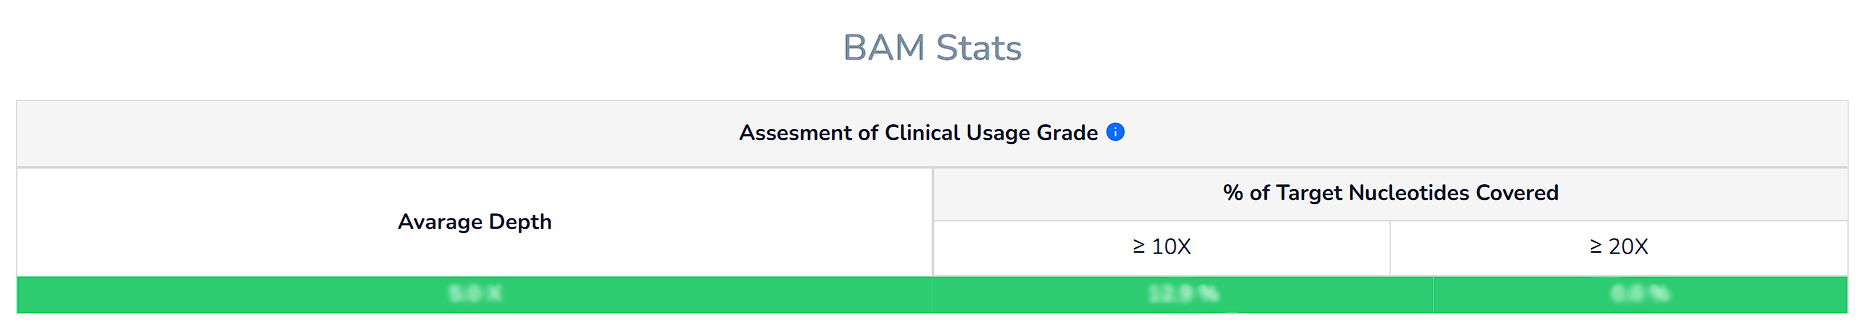
Statistics
We indicate whether the parameters of your exome/genome sequence analysis reach a clinical usage grade using colour codes (GREEN/PASS or RED/FAIL) with the criteria described in the literature.
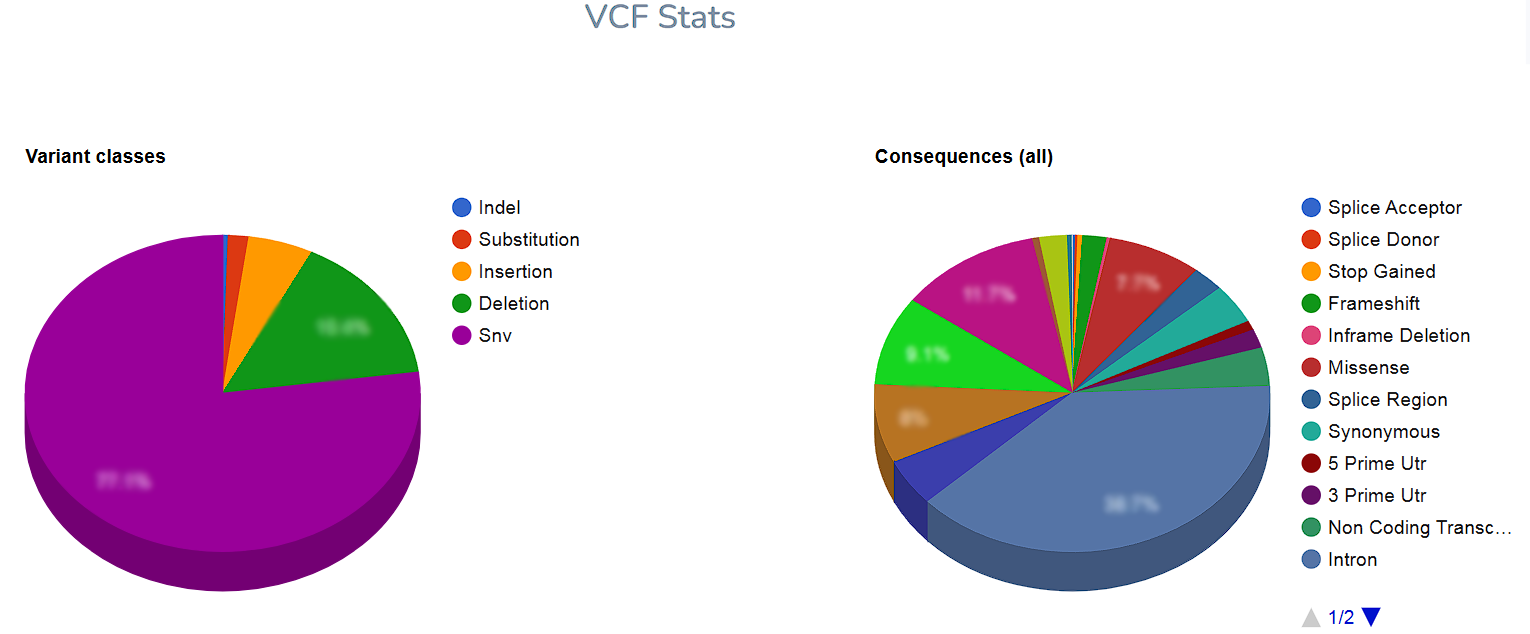
You can find the total number of variants detected in the sample and the distribution according to the primary classification (SNP, Indel) and effect classes.
You can find genome-wide quality parameters for various characteristics of variants such as Indel/SNV Ratio as shown below (three parameters in the first line). Additionally, you can find other genome-wide quality parameters regarding the expected distributions of the essential quality parameters of the variant, such as low genotype quality (five parameters in the second line).
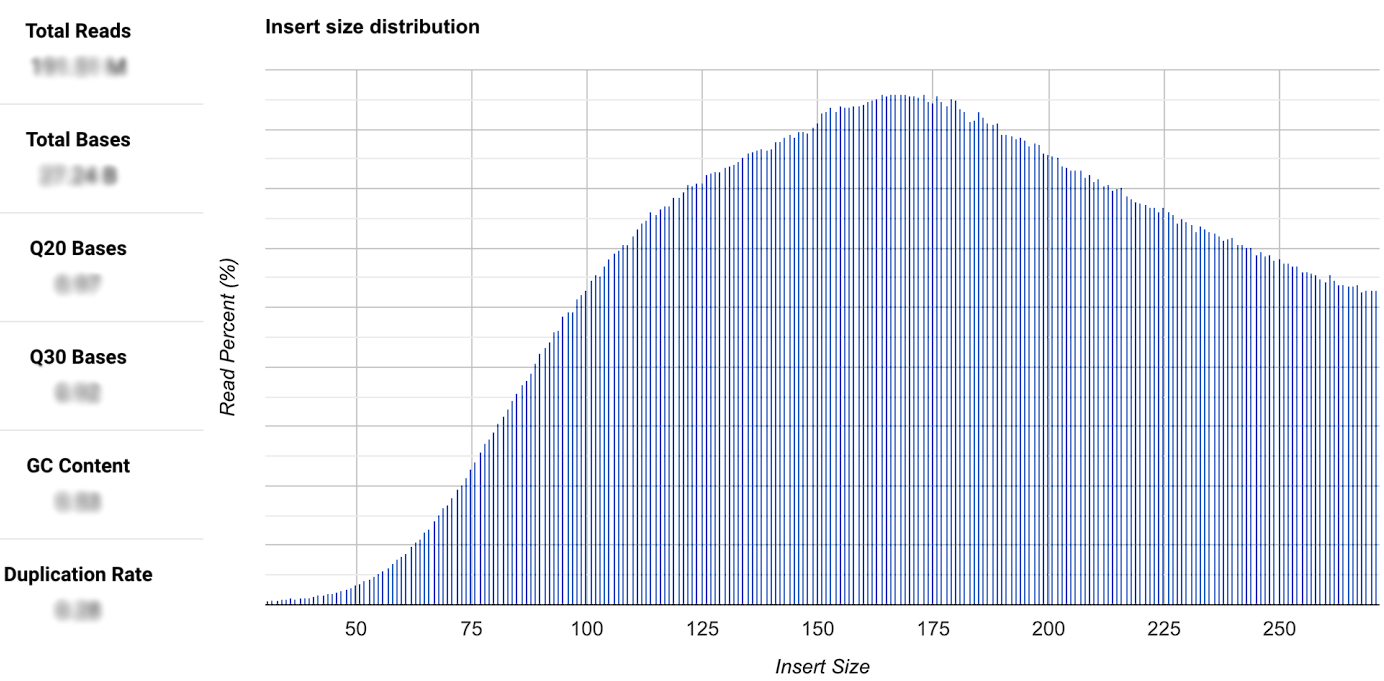
If FASTQ and BAM files are uploaded, you can also find various quality parameters in the graphic, as shown on the left side. In this area, you can access information such as Phred scores like Q20 and Q30, the total bases and the total reads, GC content, and duplication rate.